|
telescopeѲptics.net
▪
▪
▪
▪
▪▪▪▪
▪
▪
▪
▪
▪
▪
▪
▪
▪ CONTENTS
◄
4.8. Fabrication errors
▐
4.8.2. Foucault test
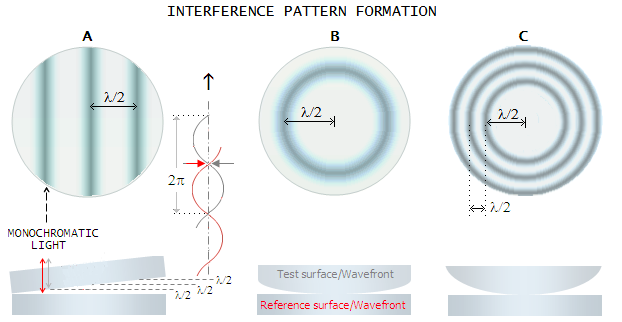
► 4.8.1. Tests for optical surface accuracy: double pass test, interferometryAmong many different types of tests for optical surface quality, a few that gained popularity among amateurs are the Foucault test, Ronchi test, Waineo null test, Hindle sphere test, Dall and Ross null test, Offner null test, double pass test and, more recently, interferometric tests. Addressing briefly the last two, the double pass test uses large flat mirror to reflect back to a surface, or to a system under test, a collimated beam produced by placing point-source of light at the surface/system infinity focus. This results in the light passing twice through a system, which doubles the effect of surface errors and, by that, test sensitivity. Contrary to the common belief, the testing flat doesn't have to be exceptionally flat. A smooth, rotationally symmetric curve over this reflecting surface will mainly cause slight change of the final focus location, without inducing appreciable effect on wavefront quality. The P-V wavefront error of spherical aberration (best focus) induced by such testing flat deformation can be expressed with the general relation for a spherical concave mirror, W=D/2048F3, with D being the flat diameter and F its focal ratio. In a more specific form, after substituting f/D for F, R/2 for f, and R=D2/8z, W=2z3/D2, z being the center depth (sagitta) of the test surface. Even as much as 1mm - or 1818 waves of 550nm wavelength - deep curve on a 250mm flat will produce only 1/17 wave P-V (550nm wavelength) of spherical aberration at the best focus (with F=D/16z, this "flat" is a 250mm f/15.6 sphere). But this is only the error produced in the first reflection, that of the collimated beam reflecting off flat's surface. This beam is reflected back to the system tested, which will process non-collimated beam. This much of wavefront bending would produce much more significant error in most any system optimized for object at infinity, by effectively placing the point-object at the distance equal to the focal length of the "flat" (in other words, by making the light reflected toward system under test slightly divergent, or convergent). In this case, the beam reflected back to the system under test is as if coming from a point at as little as 3.9m. It would induce significant error (spherical aberration) to most optical surfaces, or systems. A hundred times longer focal length - i.e. an 18 waves deep flat - would induce negligible error to most systems. For a paraboloid, the object distance induced spherical aberration, as the P-V wavefront error at the best focus, is W=(1-ψ)ψD/512F3~ψD/512F3, with ψ being the inverse of object distance in units of mirror focal length. It would take D=500mm f/4 paraboloidal mirror to produce 1/7 wave P-V of spherical aberration for that object distance, which is already unacceptably larger error (which means that faster and larger paraboloids generally require higher quality testing flat). In terms of "flat's" sagitta z, the P-V wavefront error induced to a setup due to the effective point-object distance is given by W={[K+(1-32zF/D)2]D}/2048F3, where K is the mirror conic. For a paraboloid and K=-1, W~z/32F2. Rotationally asymmetrical surface deviations of the testing flat - specifically the astigmatic type - are much less forgiving with the double pass test. Any surface error here will double in the wavefront, and a good flat shouldn't have significantly more than ~1/20 wave P-V surface error of this type of deformation. Similar applies to random surface deviations and roughness, which would prevent the tester to judge smoothness of the test surface(s). Interferometric testing of optical surface quality makes clever use of the interference of light which, under specific conditions, can produce visual patterns disclosing surface "topography" down to a fraction of a wavelength. In general, the interferometer is an optical device combining two wavefronts - one reference, perfect, and the other produced by the test surface - in order to produce the interference pattern making test surface literally visible at well below the sub-wavelength size level. The simplest, and probably the oldest interferometer consists of two flat surfaces positioned at a slight angle one to another (FIG. 50 A below). As light passes through the two pieces of glass (refraction is negligible at the actual tilt angles for principal rays/wavefront), at every section where the gap increases by about 1/2 wave, waves tend to interfere destructively, forming dark lines, so called interference fringes. The shape of lines depends directly on the surface shape.
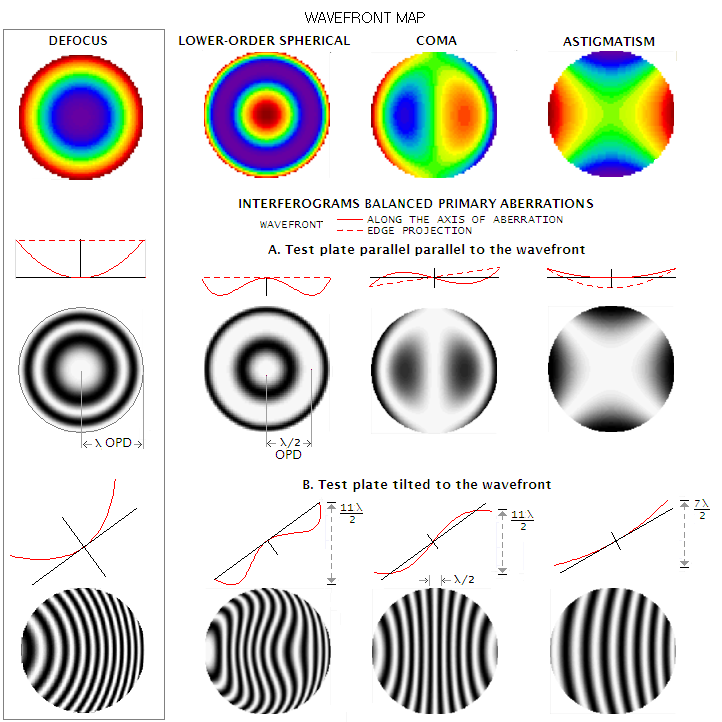
Since conic aberrations cause different form of wavefront deformations, they also show distinctly different interferometric patterns (and since wavefront deformation relative to a reference sphere varies with focus point within the aberrated focus zone, interferogram patterns will also be different for best focus vs. other focus points for each particular aberration). The fringe spacing in a single-pass interferometer corresponds to λ/2 differential on the surface, or λ on the wavefront; in a double-pass interferometer fringe spacing corresponds to half as large surface/wavefront differential.
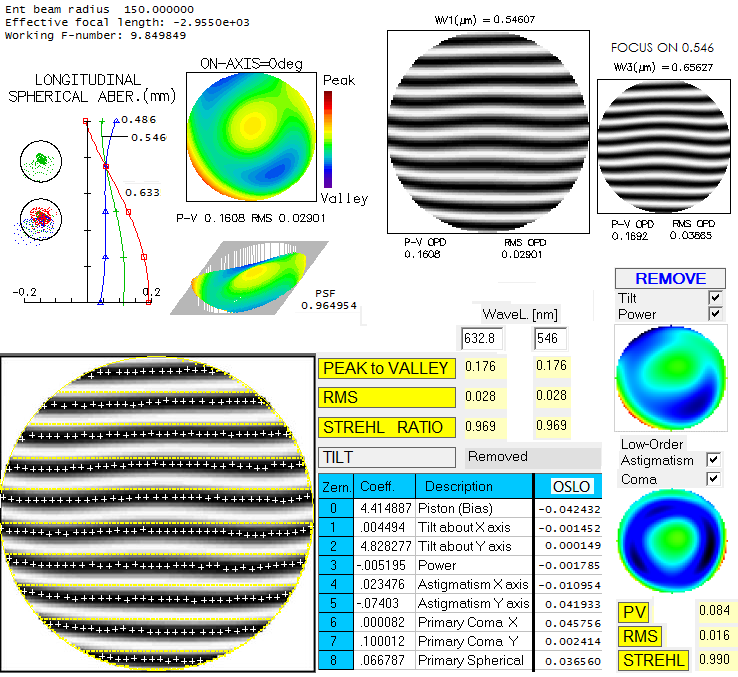
Top left shows system's longitudinal aberrations and ray spot plots
for blue (F, 486nm), green (e, 546nm) and helium-neon line (He-Ne, 633nm),
the last
being the line interferometers commonly work with. Next to it is
the center point wavefront in OSLO. To the right are
synthetic i-gram of the wavefront in e-line (center) and helium-neon
line with e-line best focus (top right). Evidently, if a system
with axial chromatic error is tested in the helium-neon line, it will
not show the error at the e-line focus. Instead, it will show the
helium-neon line error, either somewhat defocused (with best
e-line focus), or at the best helium-neon line focus, generally
different from the error at the e-line focus. Hence, such systems, or
elements, need to be tested in their optimized spectral line. Interferometer can be fairly easily built by an amateur. While high optical quality can be achieved, or confirmed, with more traditional tests, like Foucault, interferometric test has the advantage of being able to test and quantify the entire surface. Also, coupled with a computer software program, it allows for efficient, flexible fringe analysis. Various forms of interferometer adopted to amateur's means and needs have been created by amateurs' ingenuity. Some of the examples include Bath inteferometer, Shearing interferometer, and Fizeau interferometer.
Follows more detailed description of other tests mentioned above:
Foucault's, Ronchi, Waineo, Hindle, Dall, Ross and Offner null tests. ◄ 4.8. Fabrication errors ▐ 4.8.2. Foucault test ►
|